
General
Clicking onCustom Views in the left sidebar and selecting Diagram displays all available diagram views. Clicking on a list item opens the corresponding view.
Diagram Toolbars
In the following list, the functions of the top toolbar within diagram views are explained from left to right:View Titleand –if active–Context VieworFocus ViewSearch Bar: finds, highlights and focuses the view on searched assets
Edit Mode Toggle: activates or deactivates the creation and modification of assets, relations and their propertiesEdit – Add Asset(only when “edit mode” is activated)Edit – Add Relation(only when “edit mode” is activated)Edit – Save View as Default: Persist the current view configuration (selected filters & analysis rules) as standardEdit – Edit View: jump directly to the “edit view” window for this specific view

Layout – Relayout: rearranges assets and relations according to the selected last layoutLayout – Select: Switch between “Hierarchic”, “Organic” and “Orthogonal” Layout
View– (two dashes): Switch betweenAll Assets,Only Isolated AssetsandOnly Connected AssetsView – Toggle Sublabels:View – Toggle Relation Labels:View – Toggle Relation Folding:Export – PNG Export: download the current view as PNG fileExport – View Export: download the current view definition as “qb file”.


Fit Diagram to Screentriggers showing all assets and relations at once
Zoom Inenlarges the size of the shown diagram section
Zoom Outshrinks the size of the shown diagram section
Layouts
Different layouts for the diagram can be applied to properly illustrate the IT landscape:Hierarchic, Organic and Orthogonal.
Hierarchic Layout
According to theyFiles documentation the “hierarchical layout style aims to highlight the main direction or flow within a directed graph. The nodes of a graph are placed in hierarchically arranged layers such that the (majority of) edges of the graph show the same overall orientation, for example, top-to-bottom. Additionally, the ordering of the nodes within each layer is chosen in such a way that the number of edge crossings is small.”
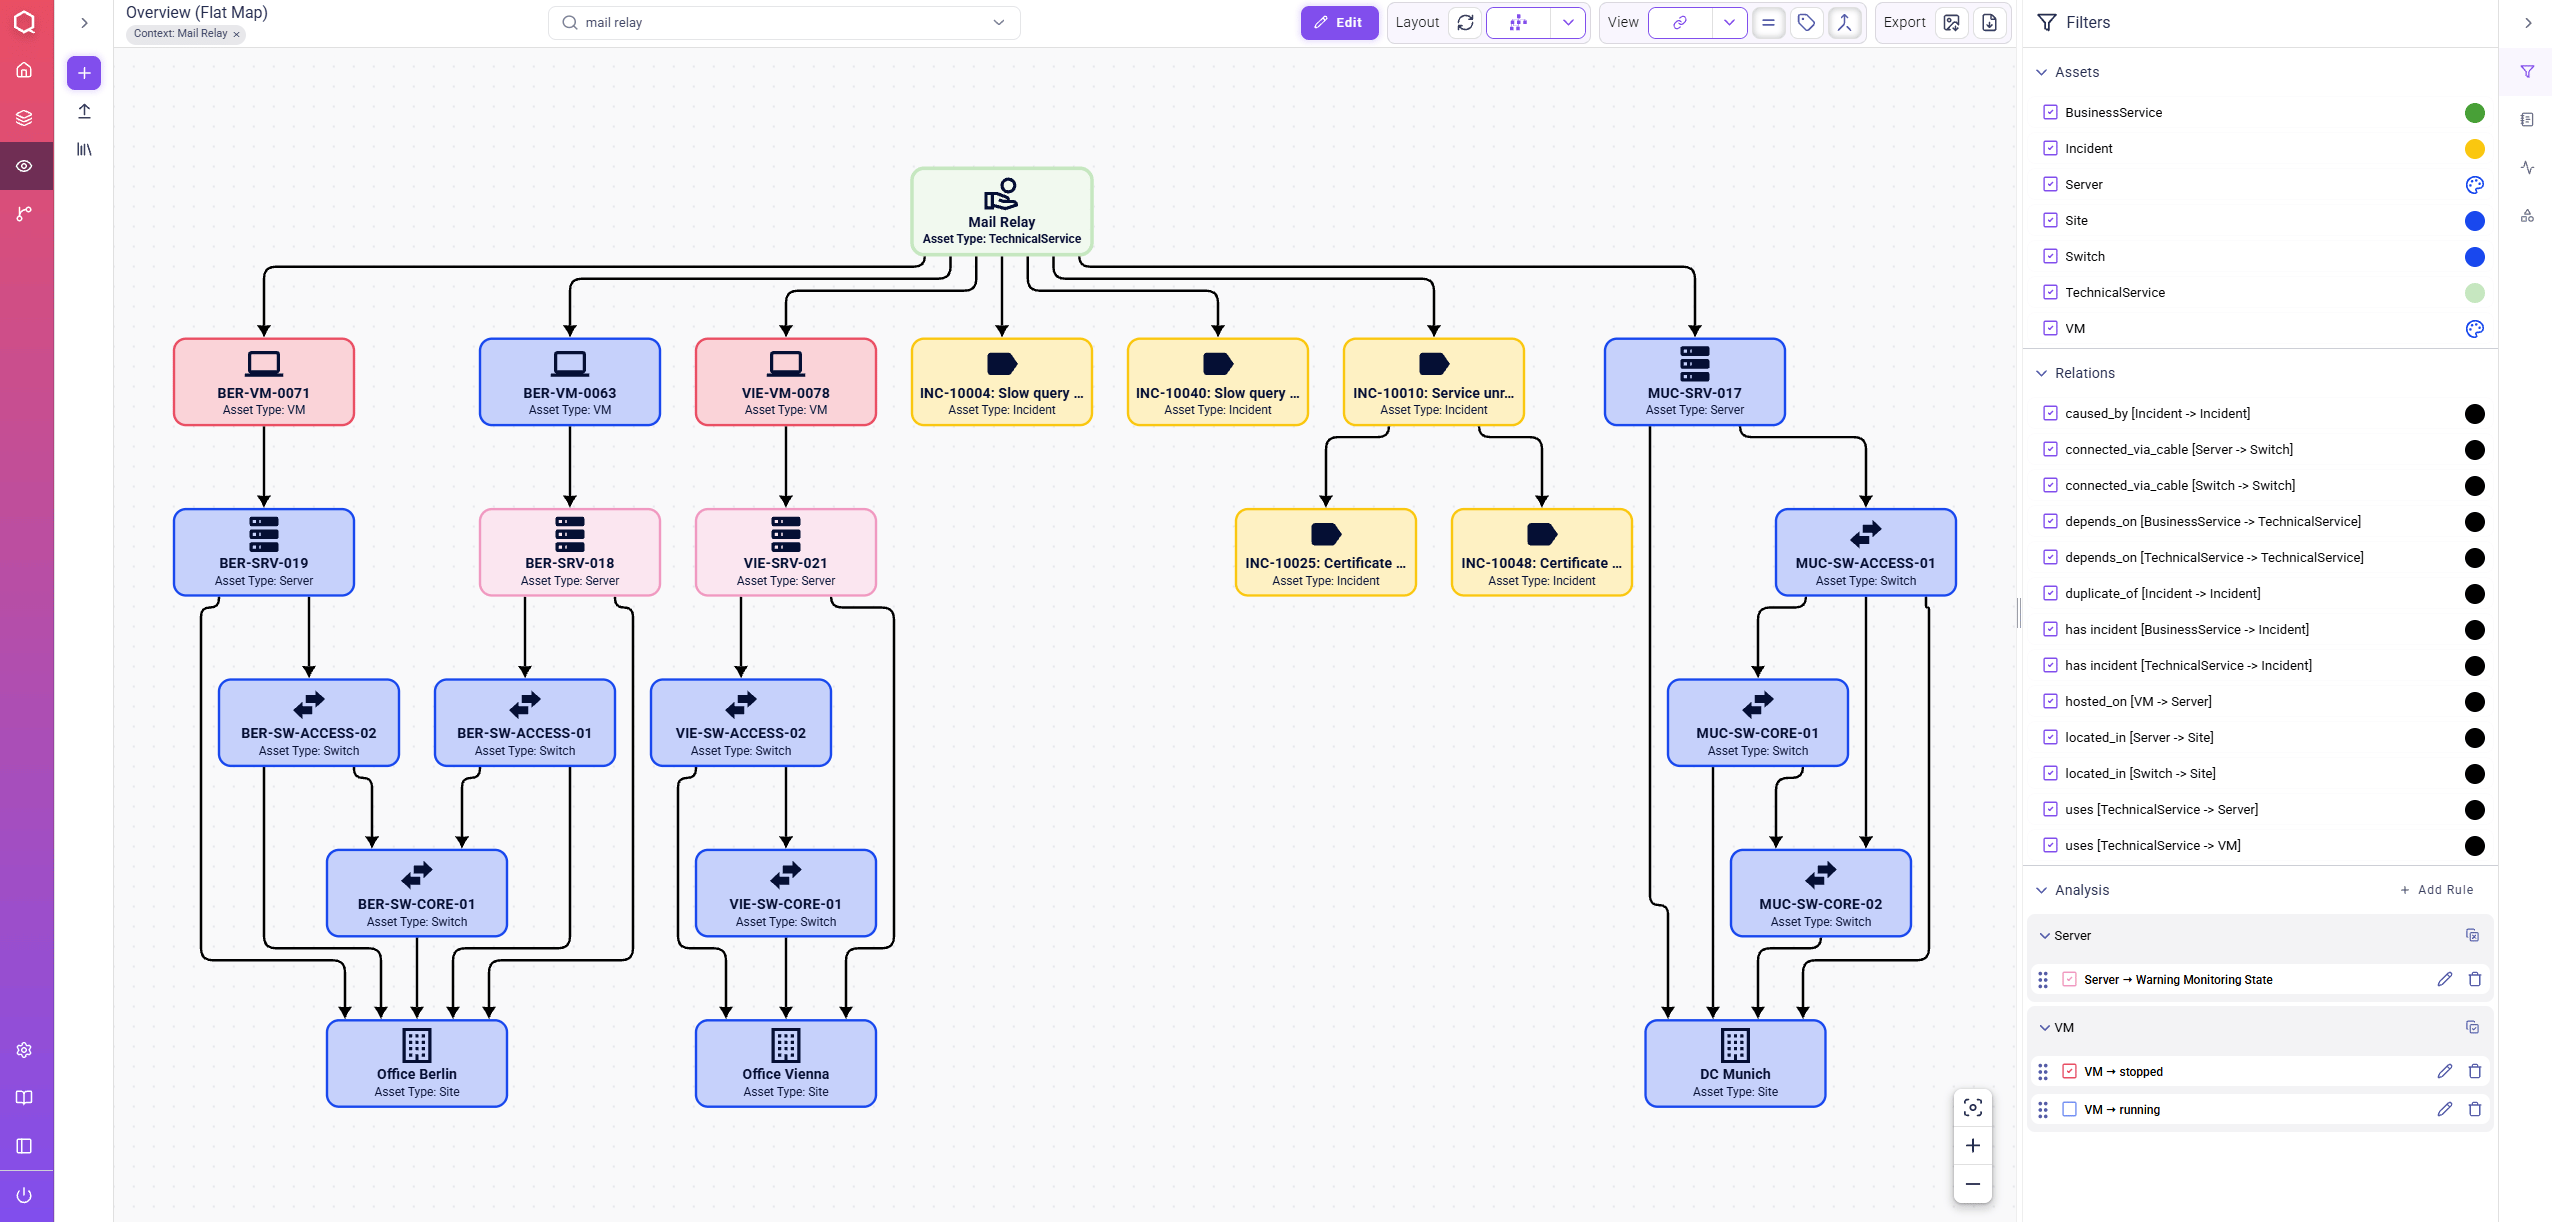
Organic Layout
According to theyFiles documentation the “organic layout style is based on the force-directed layout paradigm. When calculating a layout, the nodes are considered to be physical objects with mutually repulsive forces, like, e.g., protons or electrons. The connections between nodes also follow the physical analogy and are considered to be springs attached to the pair of nodes.”
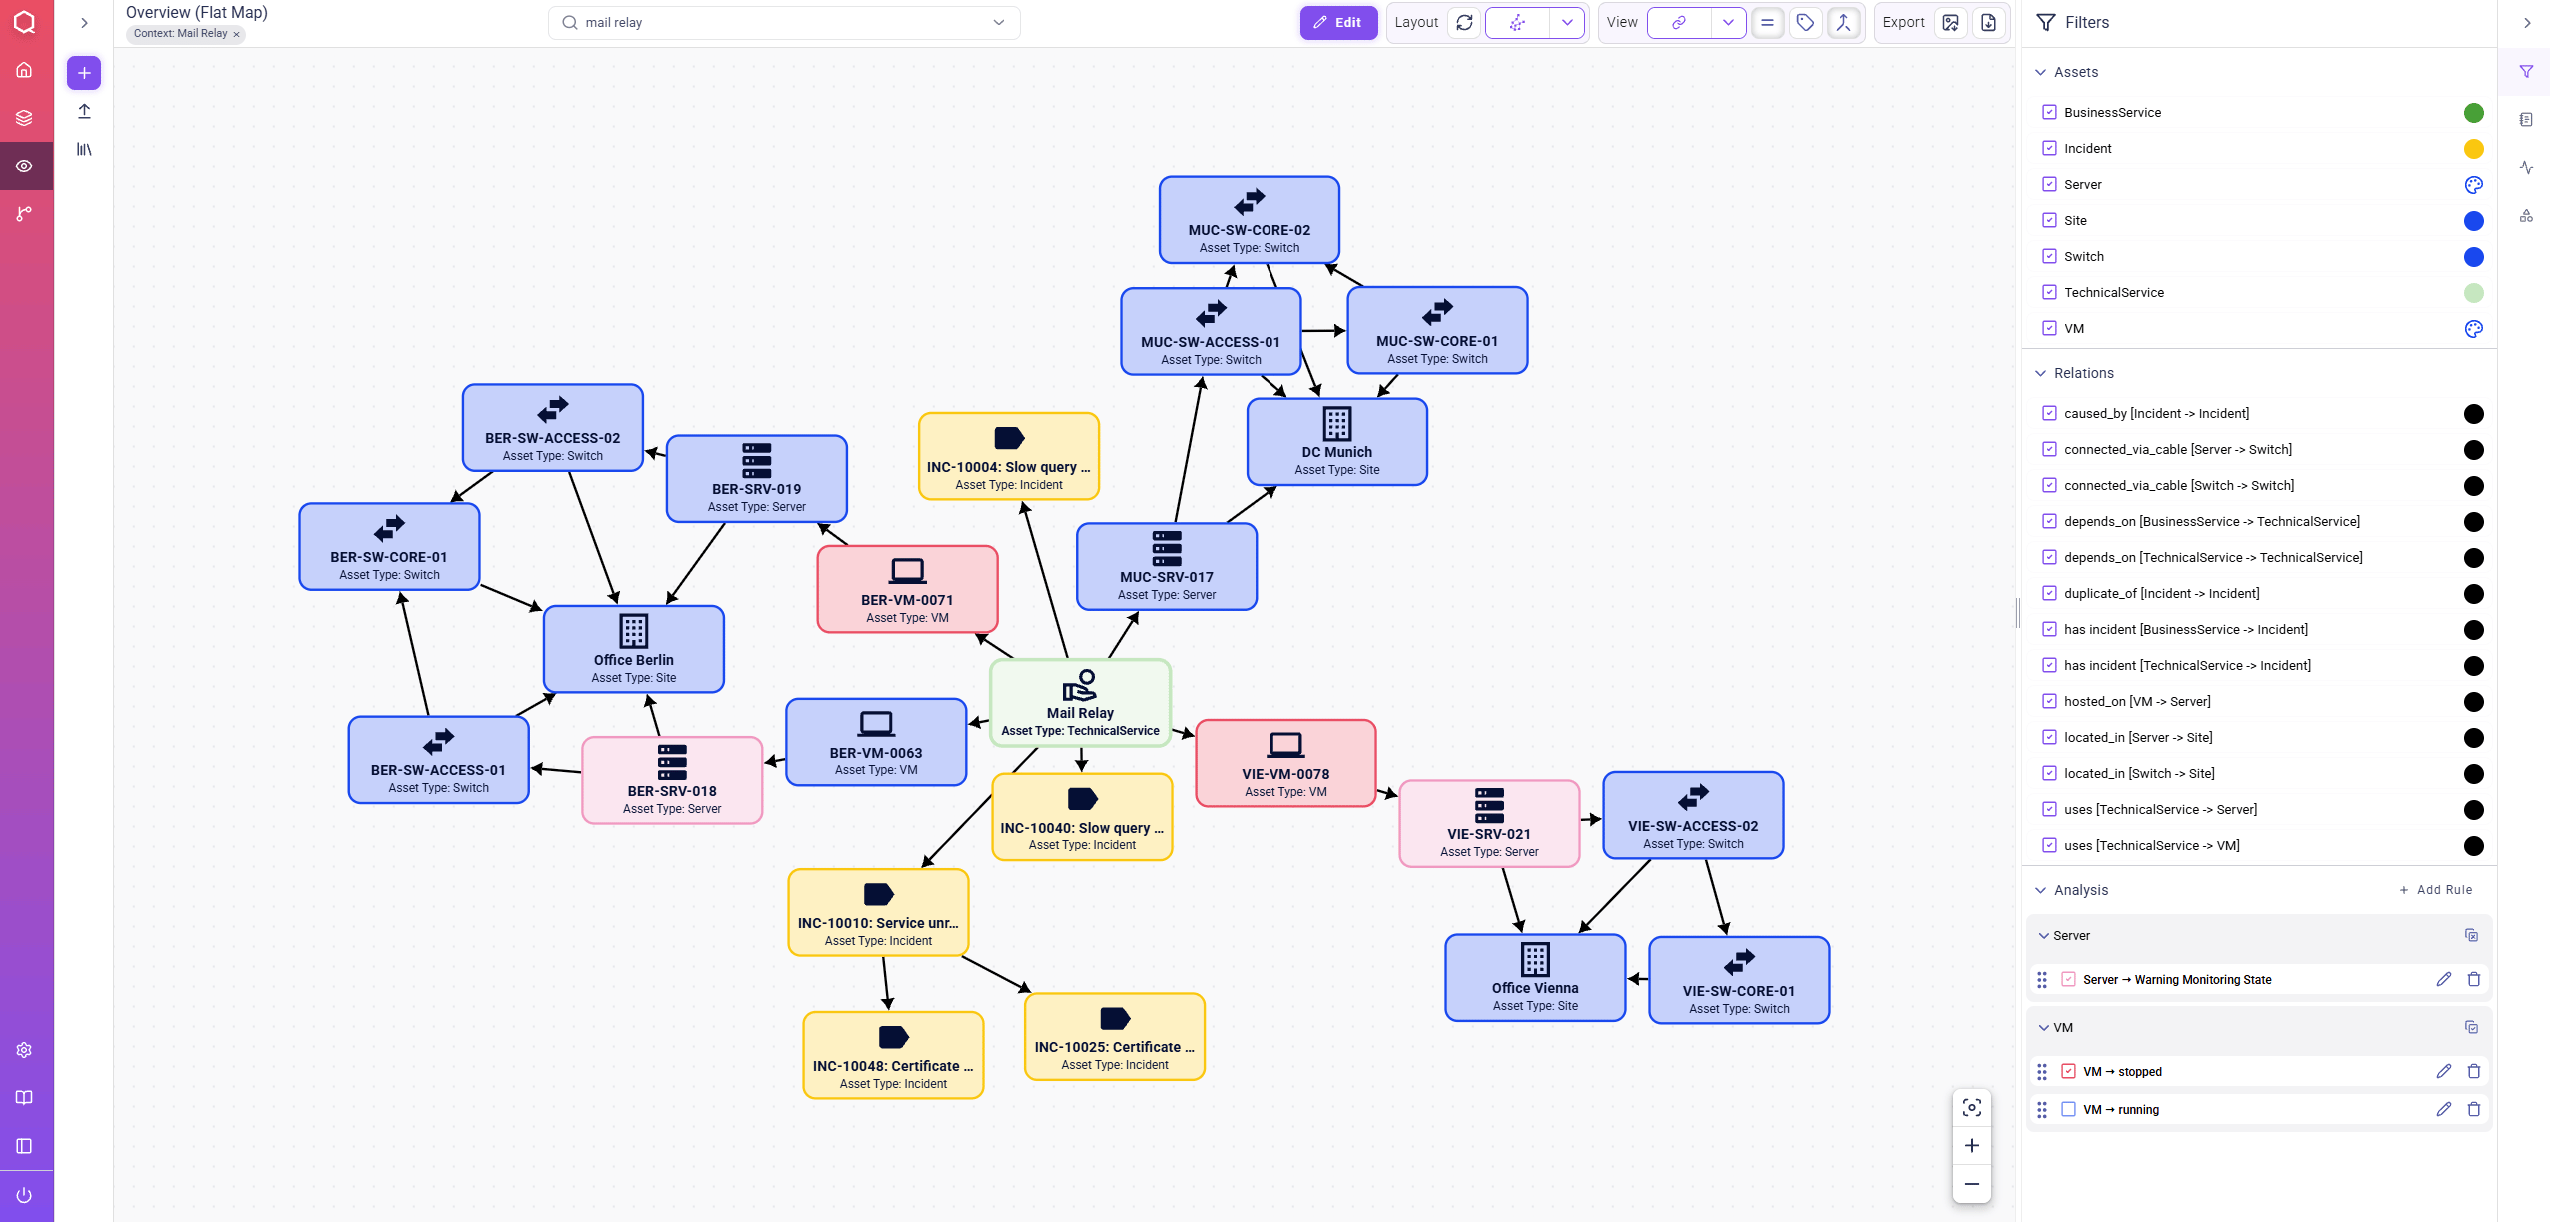
Orthogonal Layout
According to theyFiles documentation the “orthogonal layout is a multi-purpose layout provider for undirected graphs. It produces clear representations of complex networks.”
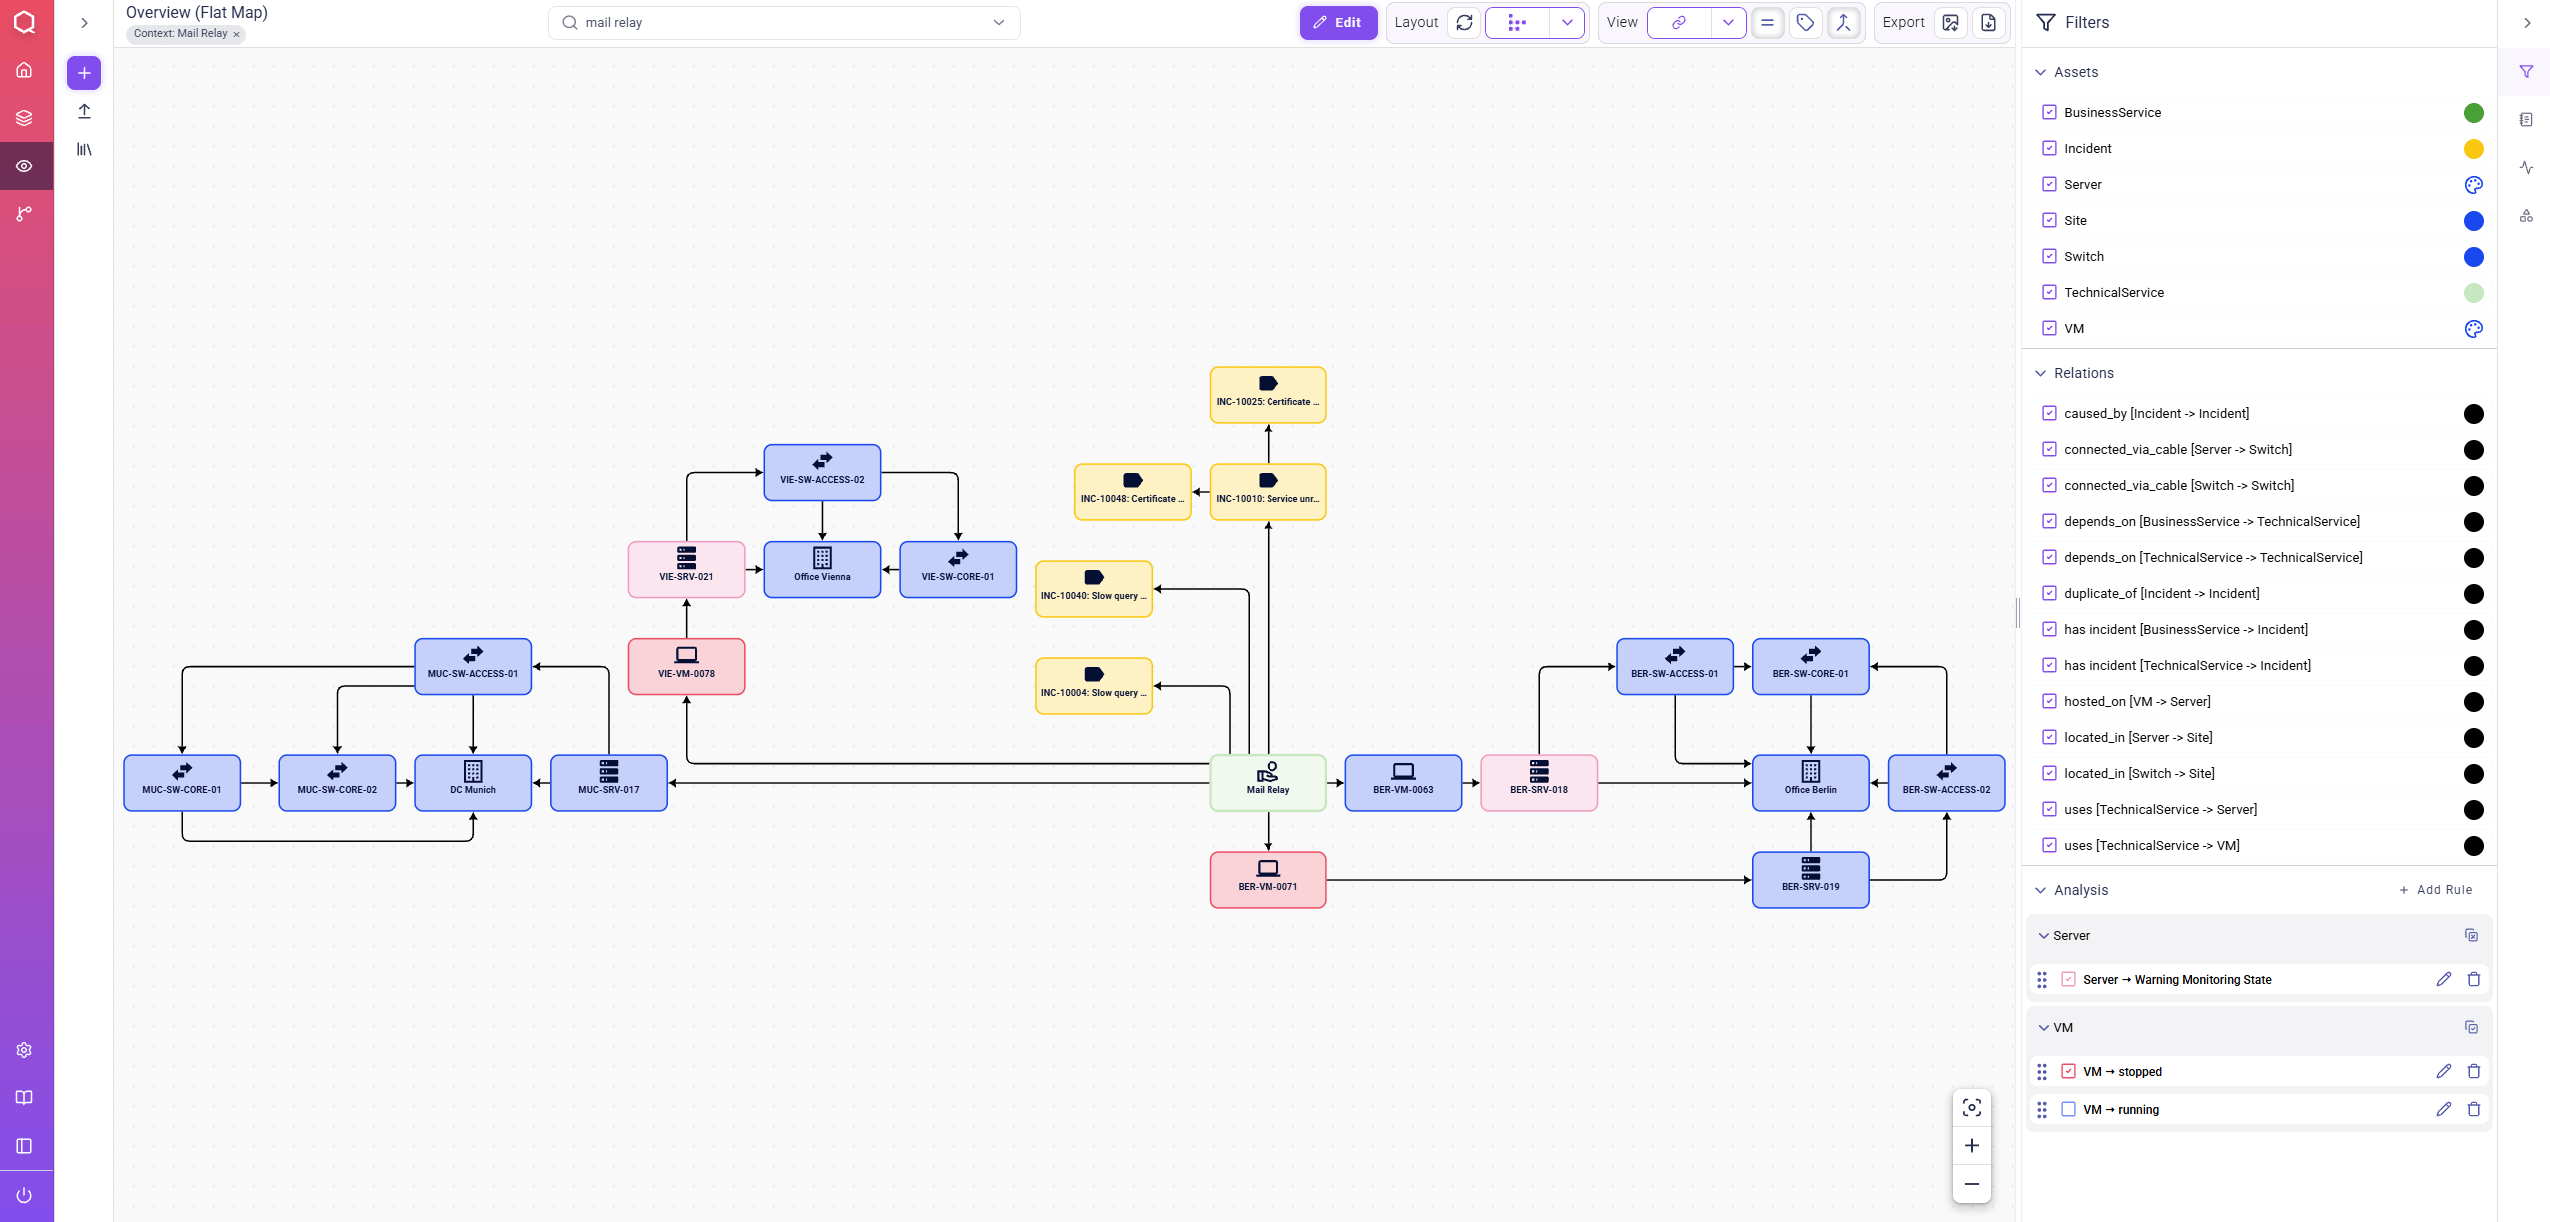
Toolbar Menu in Diagram Views
Actions for Assets & Relations

Set Focus (only for assets)
opens a “Focus View” for the selected asset that only shows the asset itself together with its direct “neighborhood”. Exiting the focus view is possible by clicking on the  icon next to the view title in the top menu bar.

Open Context View (only assets)
is used to create a context view showing a “dependency tree” for the selected asset.
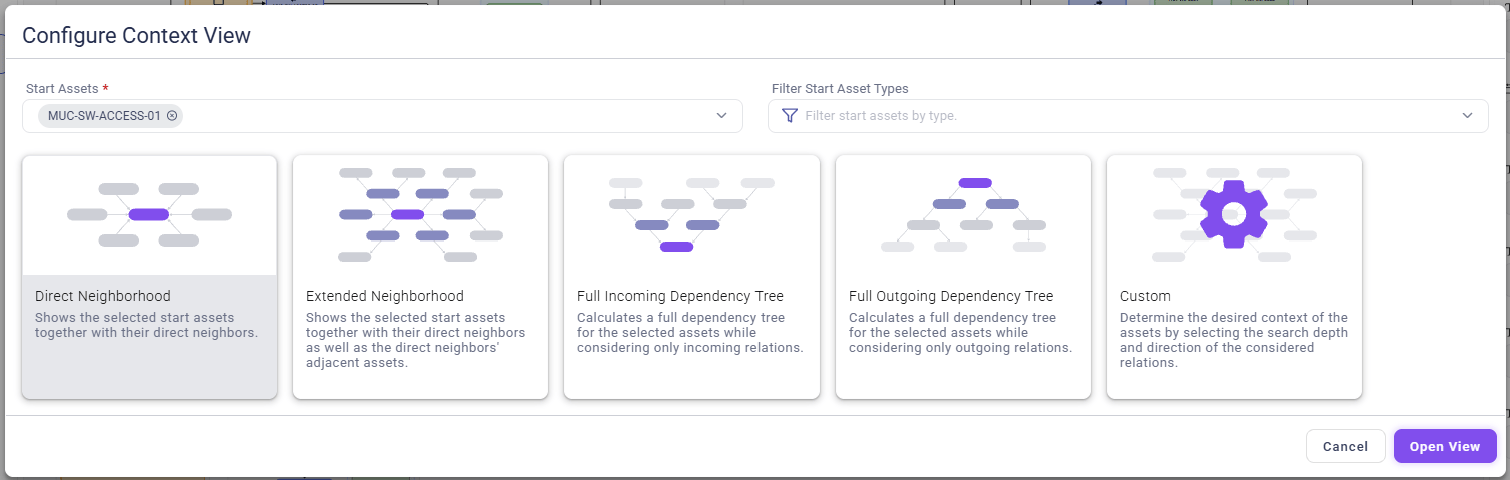
There are different kinds of configurable context views:
- The
Direct Neighborhoodview visualizes the immediate neighbor relationships of the selected asset. This allows, for example, the display of departmental responsibilities for specific products or the mapping of applications to corresponding services. - The
Extended Neighborhoodview displays all extended neighbor relationships of a specific asset. For instance, if an asset of the ‘Product’ type is chosen as the starting point, this view not only shows the direct neighbor but also assets of the ‘Application’ type and the nearest neighbors, such as a ‘Service’ asset. - The
Full Incoming Dependency Treecreates a comprehensive tree of dependencies for the selected assets, considering only incoming relationships. For example, when a server is selected, all incoming dependencies throughout the chain are visualized, starting from services and applications, all the way to organizational units. - The
Full Outgoing Dependency Treefocuses on the opposite relationships, specifically all outgoing neighboring assets. For instance, when an asset of the ‘Application’ type is selected, this tree not only displays the directly dependent services but also tracks all dependencies up to the infrastructure level. - The
Customfeature shows all neighbors according to the user’s configuration: all incoming and/or outgoing neighbors of the selected start assets are shown with a defined “depth” (Steps in Diagram) of neighborhood within the selected “General View”.

Delete Asset & Delete Relation (only in “Edit Mode”)
remove a specific asset/relation instance from the data set.
Global Actions

Expand Group Assets
increments the current “expand/collapse level” of grouped assets, so that all visible, collapsed asset containers (“group nodes”) are expanded.

Collapse Group Assets
decreases the current “expand/collapse level” of grouped assets, so that all visible, innermost asset containers (“group nodes”) are collapsed/closed.

Toggle Sublabels
switches between showing “sublabels” below the name tag of assets or hiding them. By default, sublabels are activated and show the type of each asset.

Toggle Relation Labels
switches between displaying the name labels of relations or hiding them. By default, relation labels are deactivated.

Toggle Relation Folding
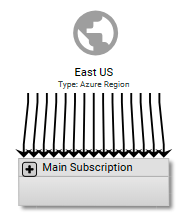
activates or deactivates the visual “merging” of multiple “parallel relations” between an asset container (“group node”) and another asset or container.
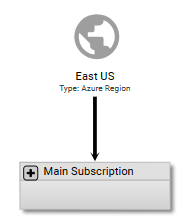

Save View as Default
stores the current view configuration as default setting including the last layouter used, currently displayed asset and relation types, all filter settings, the analysis rules configuration as well as a possibly activated focus view.
Once the default view is set, the diagram view will return to this specific state each time it is opened. In addition, the diagram view’s “preview tile” on the home screen is updated accordingly.

Open Context View
is used to create a context view showing a “dependency tree” for a set of selected assets.
There are different kinds of configurable context views:
- The
Direct Neighborhoodview visualizes the immediate neighbor relationships of the selected asset. This allows, for example, the display of departmental responsibilities for specific products or the mapping of applications to corresponding services. - The
Extended Neighborhoodview displays all extended neighbor relationships of a specific asset. For instance, if an asset of the ‘Product’ type is chosen as the starting point, this view not only shows the direct neighbor but also assets of the ‘Application’ type and the nearest neighbors, such as an ‘Service’ asset. - The
Full Incoming Dependency Treecreates a comprehensive tree of dependencies for the selected assets, considering only incoming relationships. For example, when a server is selected, all incoming dependencies throughout the chain are visualized, starting from services and applications, all the way to organizational units. - The
Full Outgoing Dependency Treefocuses on the opposite relationships, specifically all outgoing neighboring assets. For instance, when an asset of the ‘Application’ type is selected, this tree not only displays the directly dependent services but also tracks all dependencies up to the infrastructure level. - The
Customfeature shows all neighbors according to the user’s configuration: all incoming and/or outgoing neighbors of the selected start assets are shown with a defined “depth” (Steps in Diagram) of neighborhood within the selected “General View”.
+ Add Asset (only in “Edit Mode”)
starts the dialog to create a new asset as described in the section “General View Actions”.
+ Add Relation (only in “Edit Mode”)
starts the dialog to create a new relation as described in the section “General View Actions”.
”Drill Down” in Diagram Views
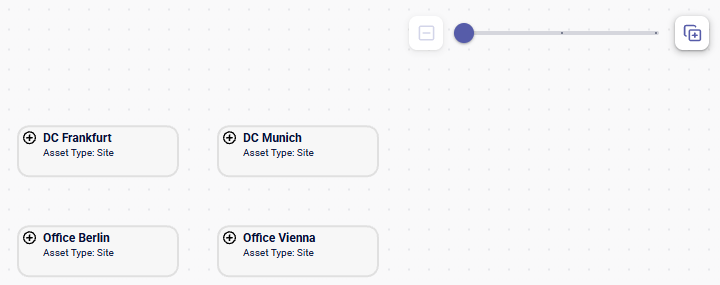
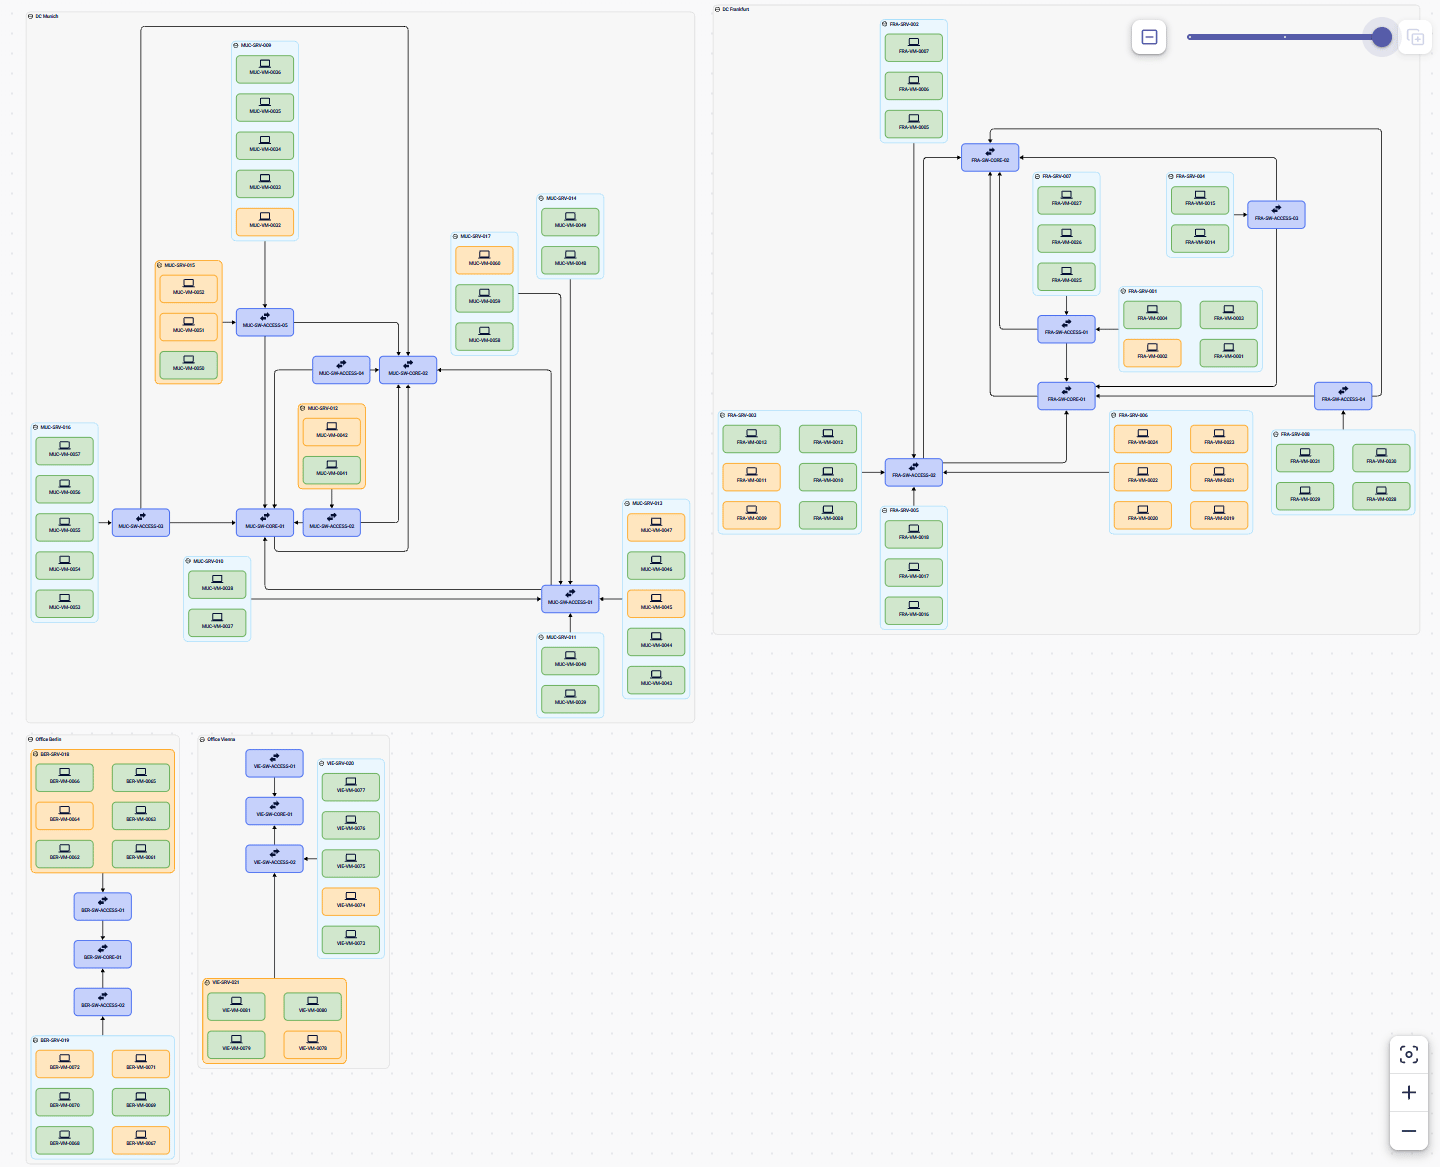
Relations can either be shown as “line” or as “container”, cf. Creating Diagrams. Interpreting and visualizing relations as “containers” makes it possible to create views with “multiple nesting levels”.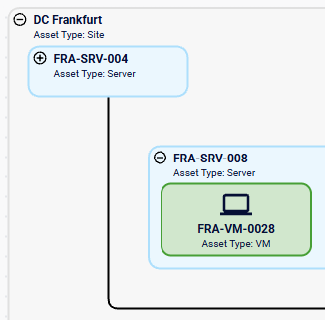

Context Views
When an asset is selected, theOpen Context Views button in the bottom menu leads to different kinds of views focusing on specific assets:
- The
Direct Neighborhoodview visualizes the immediate neighbor relationships of the selected asset. This allows, for example, the display of departmental responsibilities for specific products or the mapping of applications to corresponding services. - The
Extended Neighborhoodview displays all extended neighbor relationships of a specific asset. For instance, if an asset of the ‘Product’ type is chosen as the starting point, this view not only shows the direct neighbor but also assets of the ‘Application’ type and the nearest neighbors, such as an ‘Service’ asset. - The
Full Incoming Dependency Treecreates a comprehensive tree of dependencies for the selected assets, considering only incoming relationships. For example, when a server is selected, all incoming dependencies throughout the chain are visualized, starting from services and applications, all the way to organizational units. - The
Full Outgoing Dependency Treefocuses on the opposite relationships, specifically all outgoing neighboring assets. For instance, when an asset of the ‘Application’ type is selected, this tree not only displays the directly dependent services but also tracks all dependencies up to the infrastructure level. - The
Customfeature shows all neighbors according to the user’s configuration: all incoming and/or outgoing neighbors of the selected start asset s are shown with a defined “depth” (Steps in Diagram) of neighborhood within the selected “General View”.
Open as Context View. Afterwards, a dialog opens that allows to configure a context view as described above.
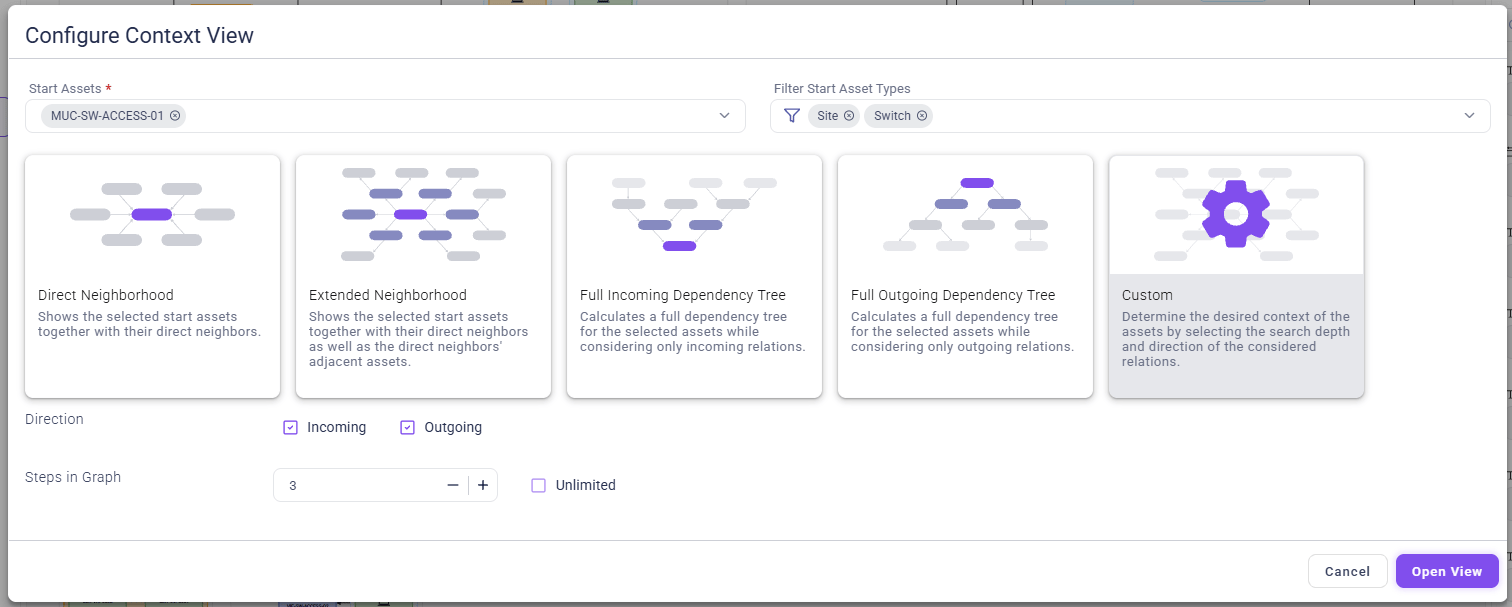
Custom Context View with individual Direction and Steps in Diagram settings